Your statistics, every channel in one place
Covers, occupancy, no-shows, loyalty, satisfaction — track your activity across every channel, compared over time. Included in every plan, with no point-of-sale and nothing to set up.
Every channel in one place
Booking widget, phone, walk-in, Google — Service sees all your reservations, not just one source's. You get an honest read on occupancy and no-shows that a tool seeing only its own bookings can't reconstruct. No point-of-sale required, nothing to configure, and it's included in every plan.
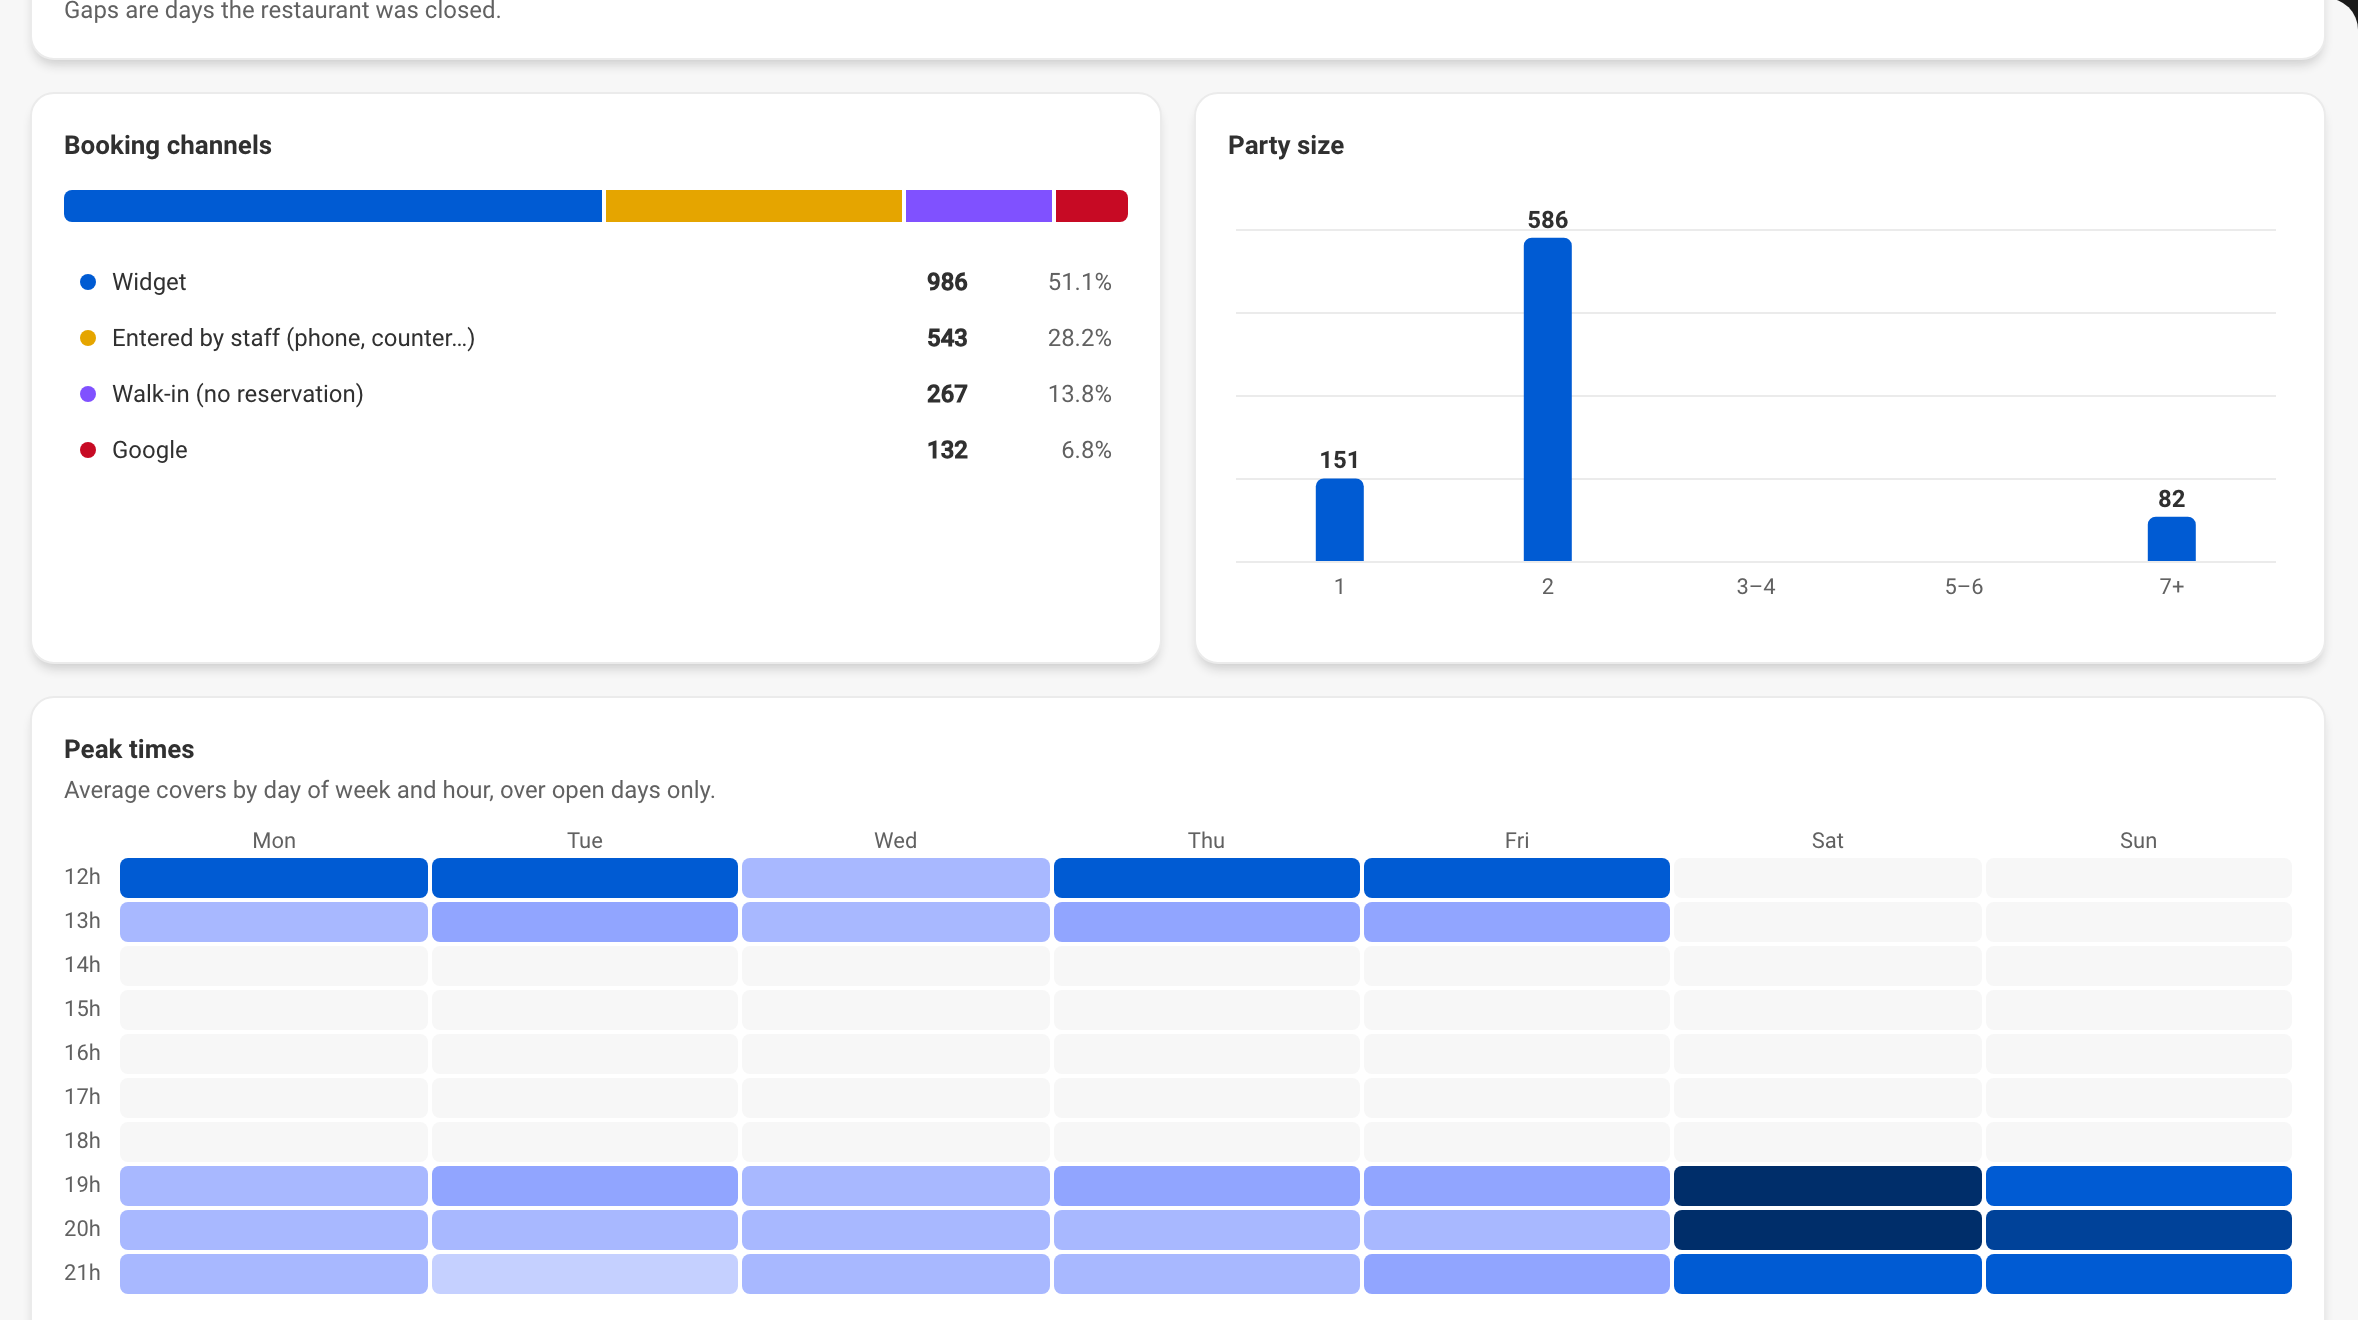
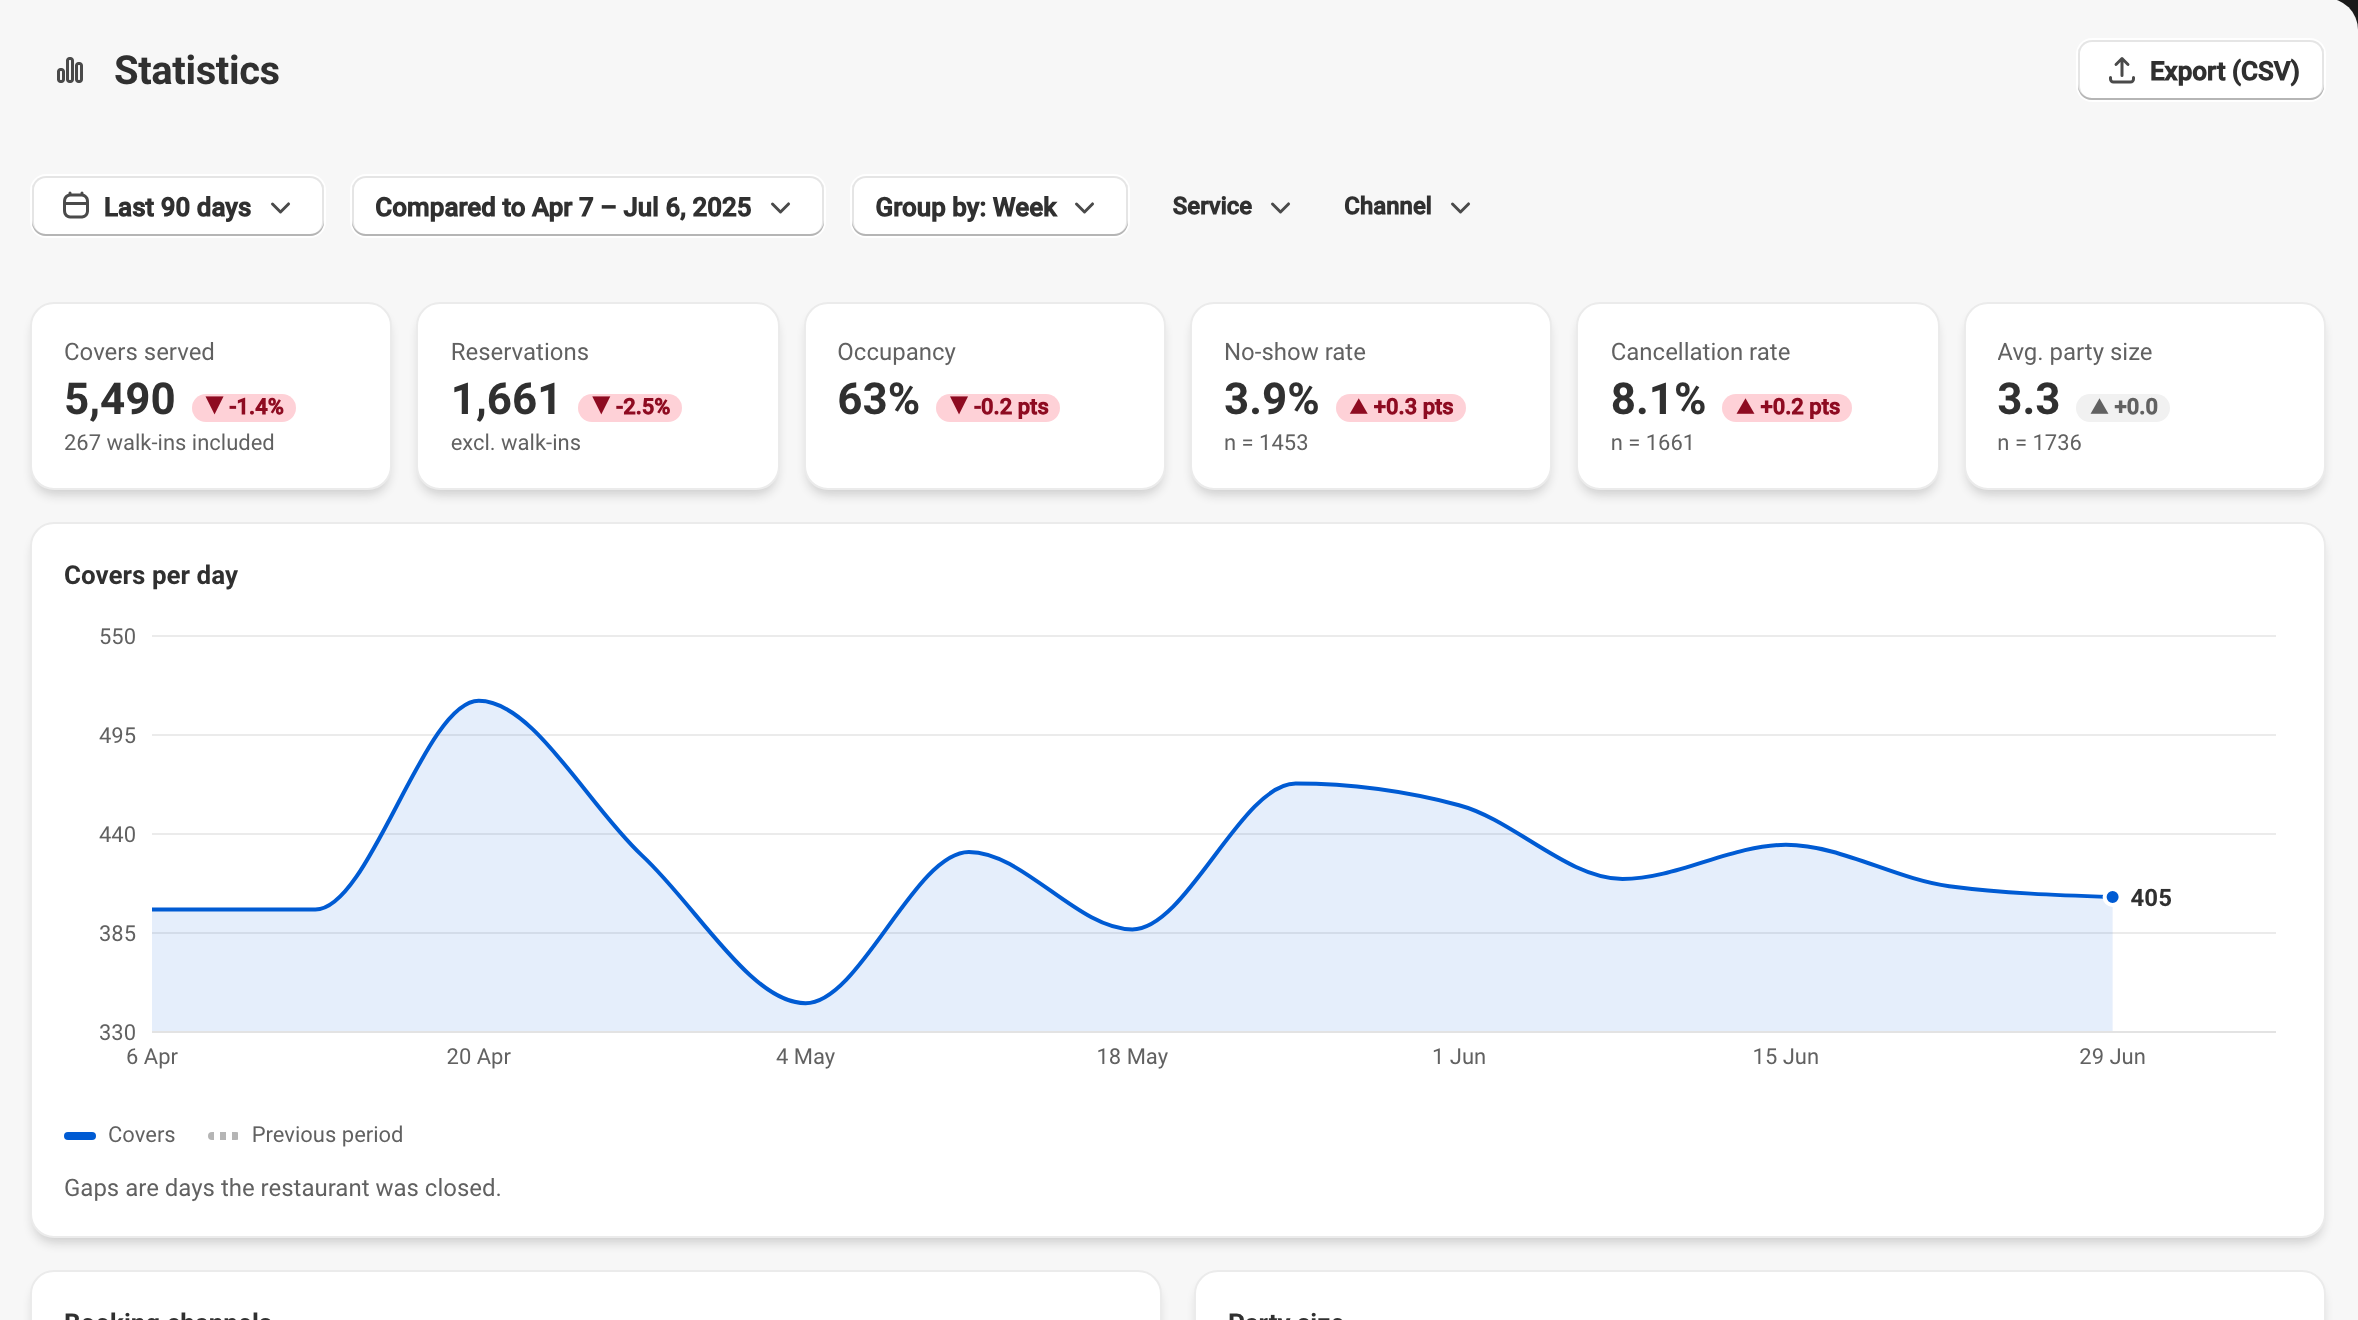
Your key metrics, compared over time
Covers served, reservations, occupancy, no-shows, cancellations, average party size — every metric compares against the previous period or the year before, so a trend jumps out at a glance. Pick the range, group by day, week or month, and export everything to CSV.
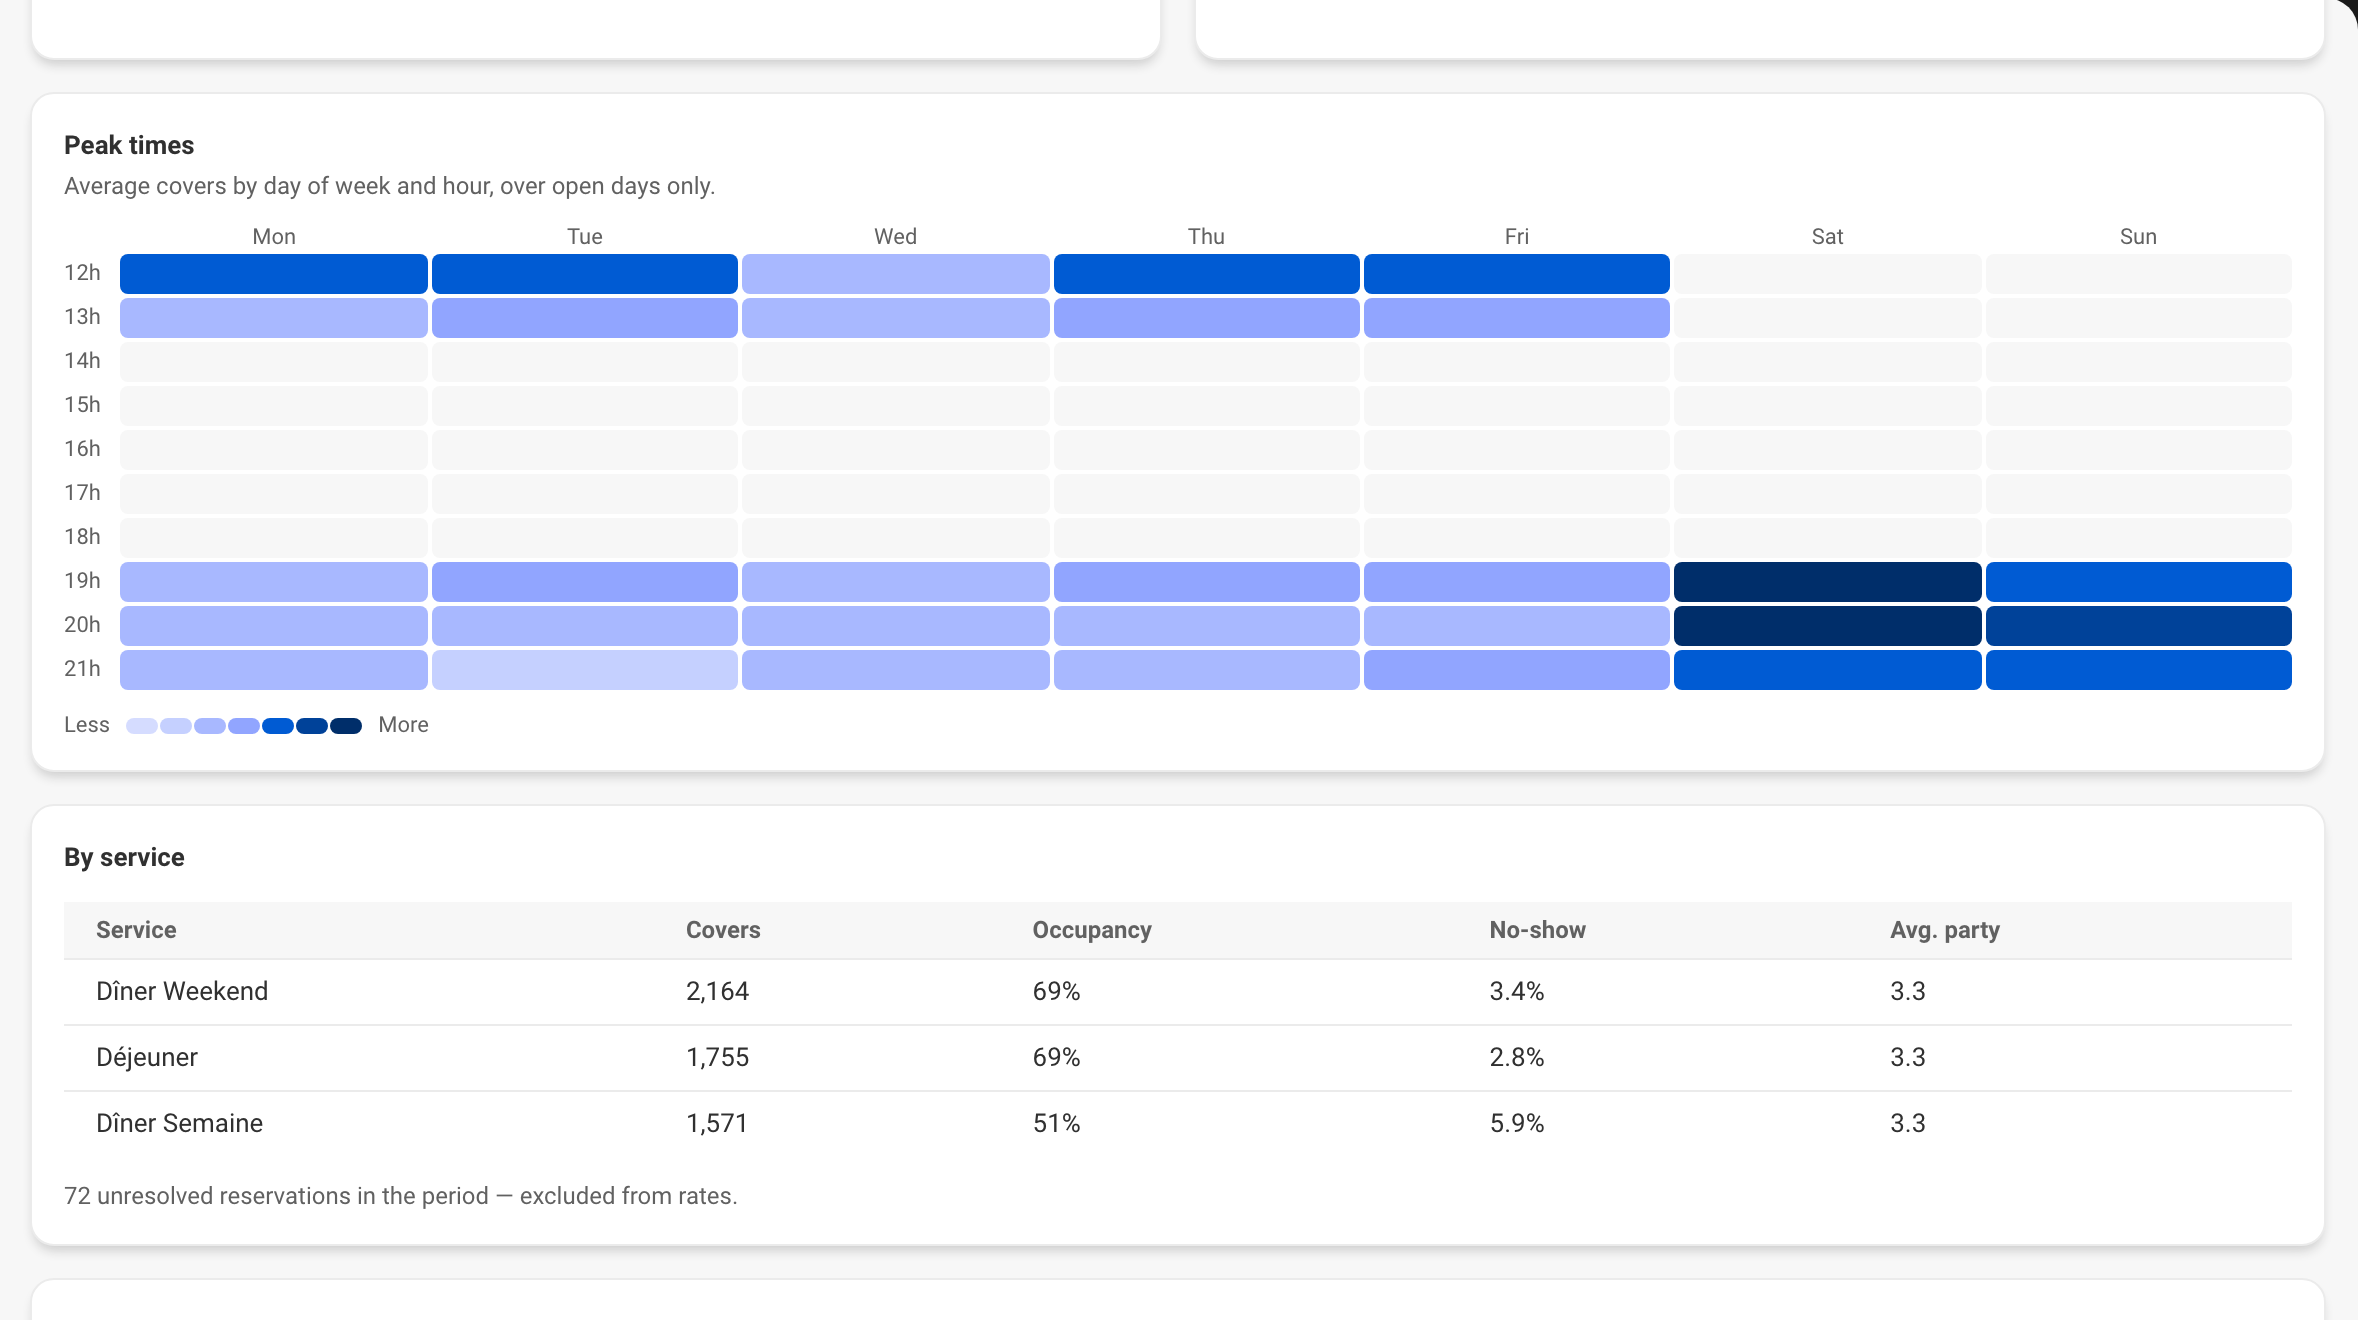
Your peak times, hour by hour
A map of covers by day of week and hour surfaces your real rushes — and your lulls. Adjust your services, staffing and floor plan on facts instead of a hunch.
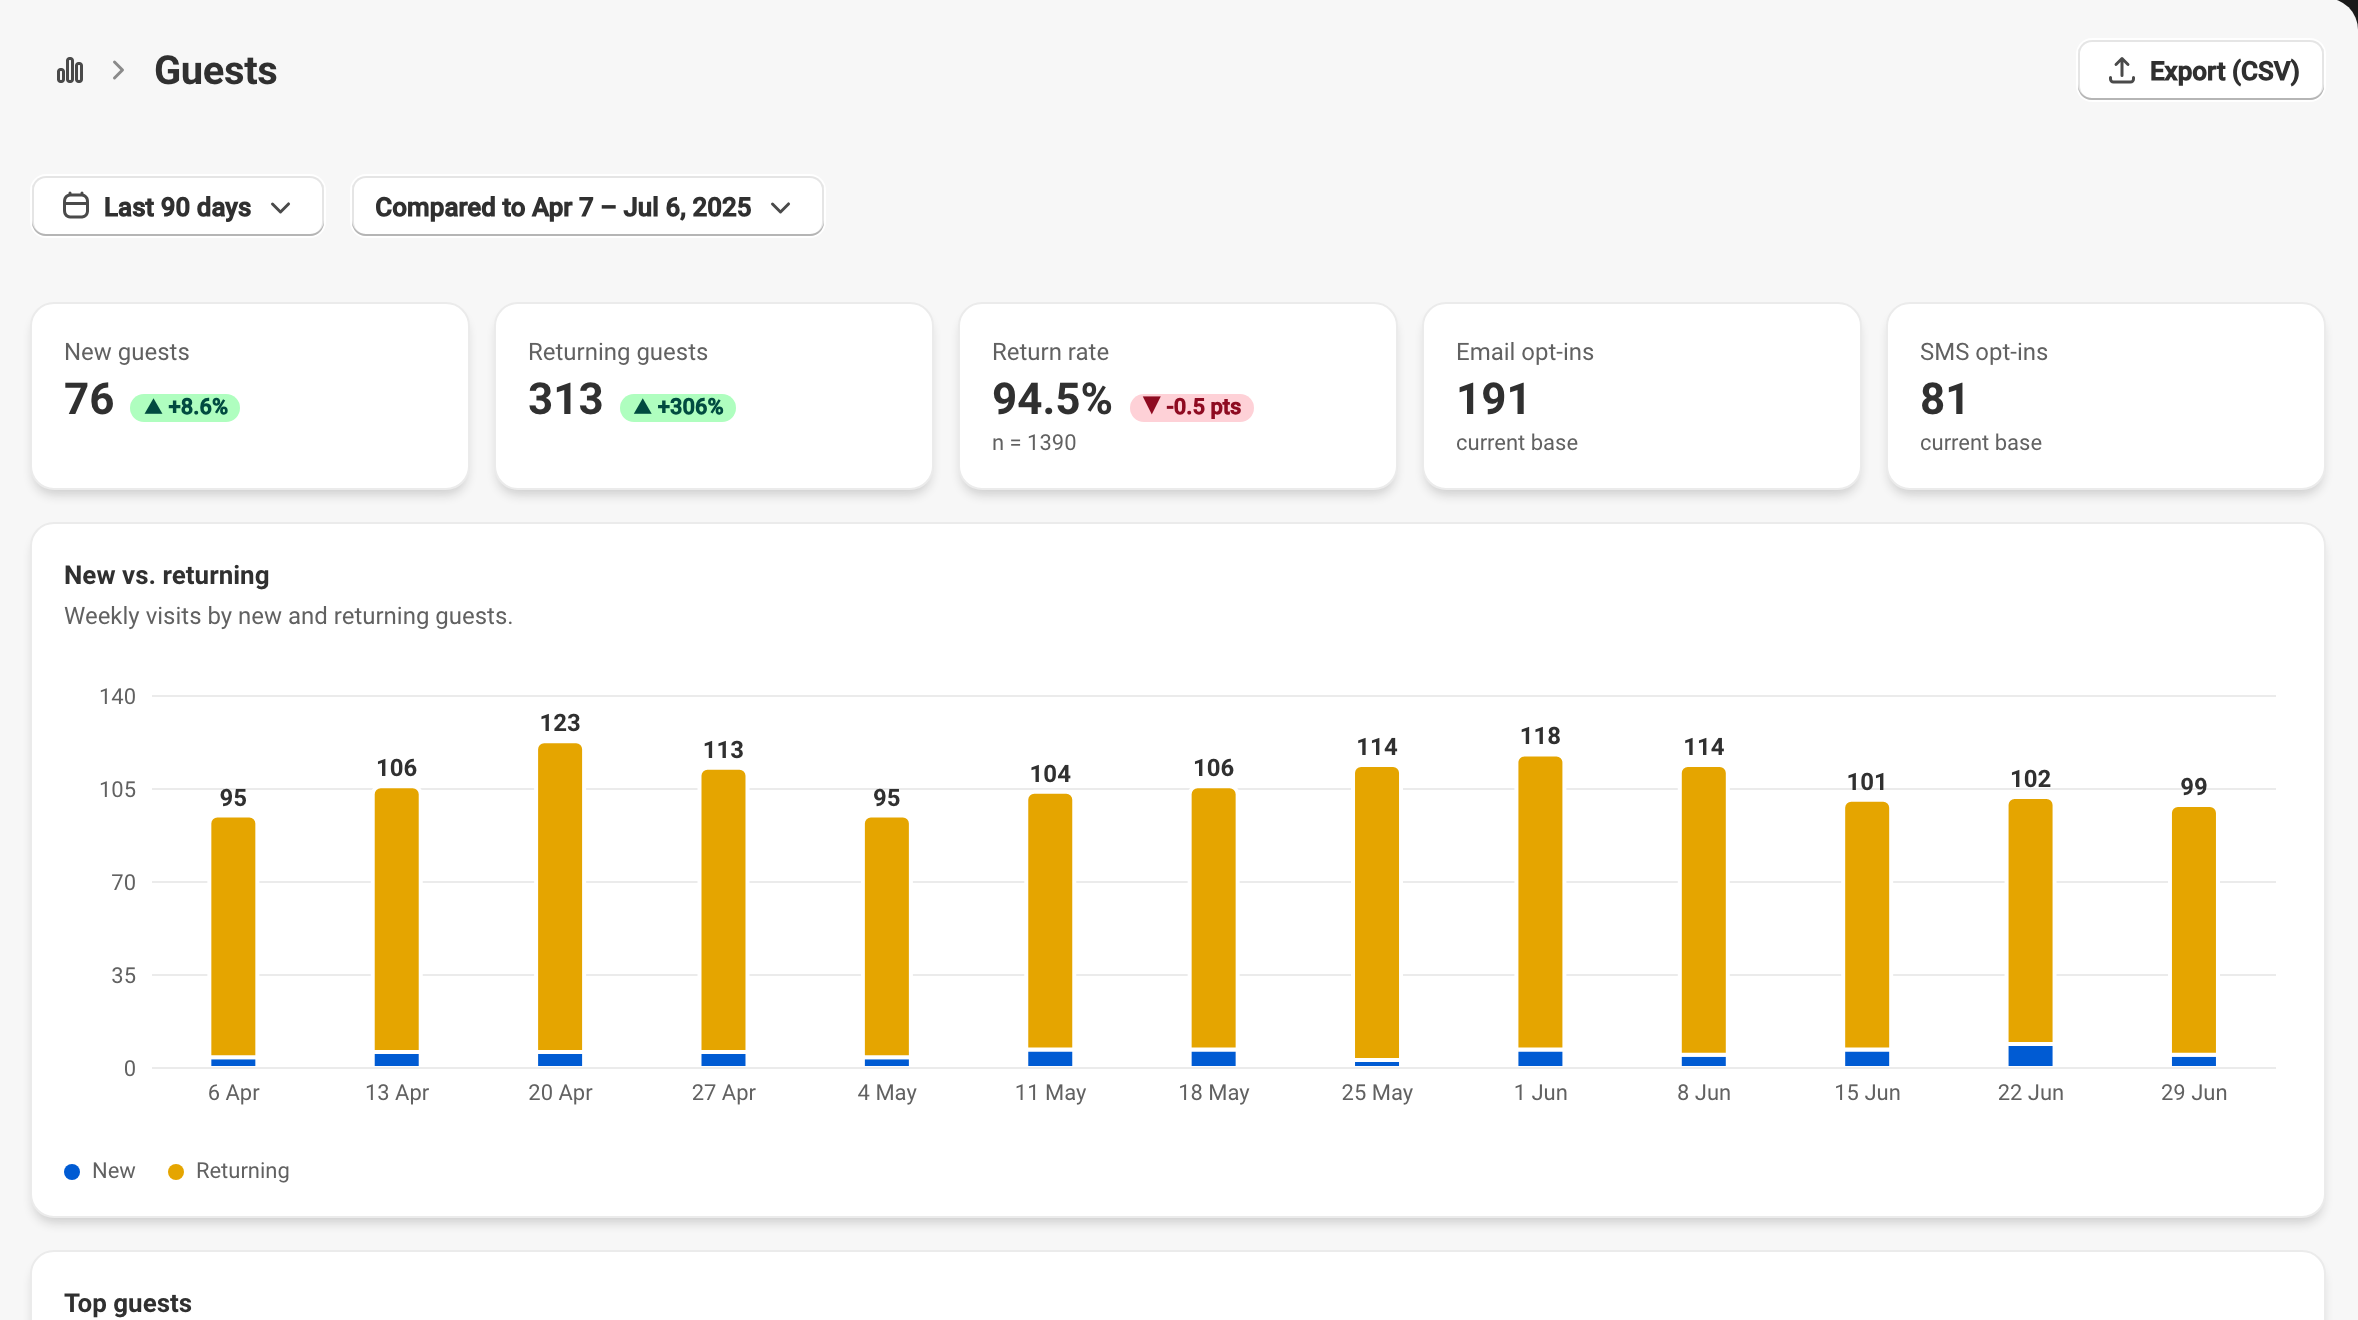
New guests, loyal guests
Track the share of new versus returning guests week over week, spot your best regulars, and measure the size of your email and SMS opt-in base — the starting point for future campaigns.
Satisfaction, in detail
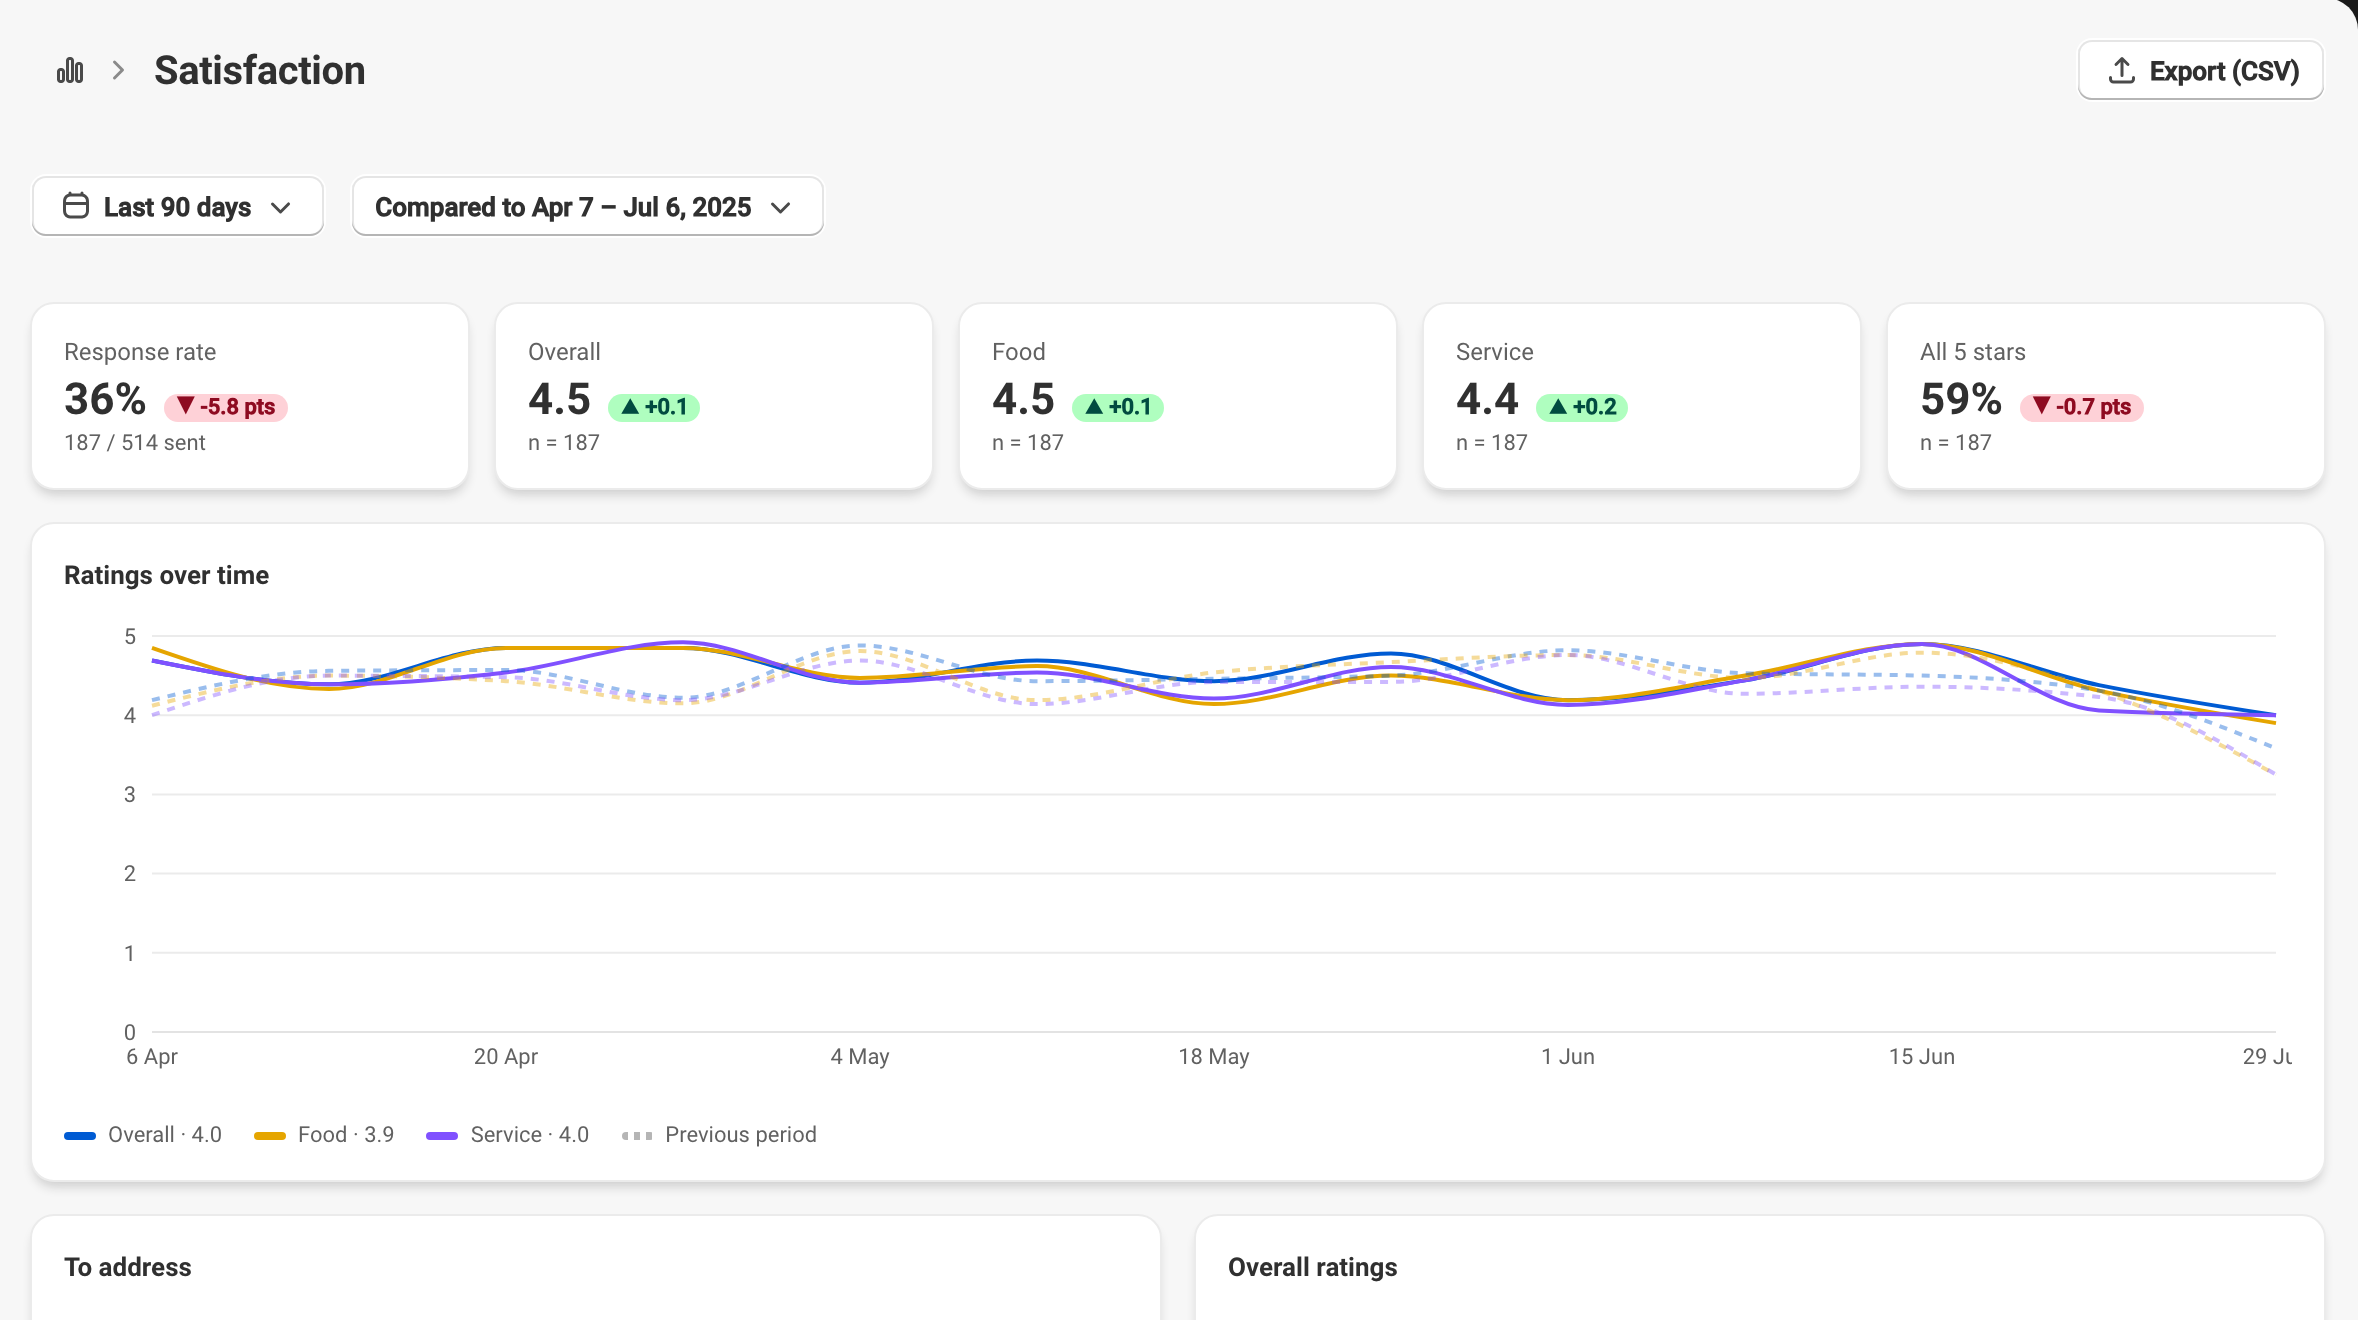
Beyond the average score, follow your food and service ratings by shift and by weekday. You pinpoint exactly where you're weak — Saturday dinner, service rather than the plate — instead of guessing.
Related features
Ready to take back control of your reservations?
Join the restaurants who are done paying commissions.
Contact us